
Some Background
I’ve been doing some work setting up a custom work item tracking process in Azure DevOps to support our current way of delivering change. Azure Boards doesn’t really support the sort of customisations we require and so I’ve broken most of the usual Agile tools such as the burndown charts. As a result I have been building our custom reporting in Power BI and have run up against the frustrating limitation that PowerQuery/M doesn’t support forecasting functions. This means that those linear regression functions such as FORECAST.LINEAR that have existed in Excel since ever are not available in PowerQuery/M. I guess as this is catered for in Power BI with visualisations and DAX Measures that the support for this isn’t strictly necessary, but my research of countless support forum posts asking for this feature with no real solution suggests it is wanted. At any rate, it is essential for what I am trying to do so I rolled up my sleeves.
The Source Data
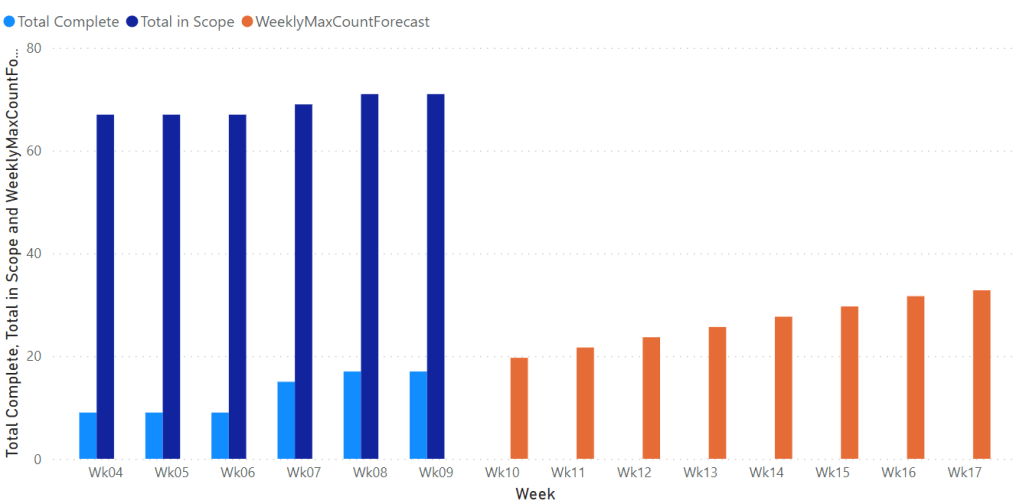
In building up my data models for rendering my burn charts I have some data like below. For each week it shows the count of some particular item – in the following screenshot this is showing the number of completed stories. I add a numeric ‘AvgIndex’ helper column that indexes the data for use in projecting ‘Ideal Trend’ and the like.
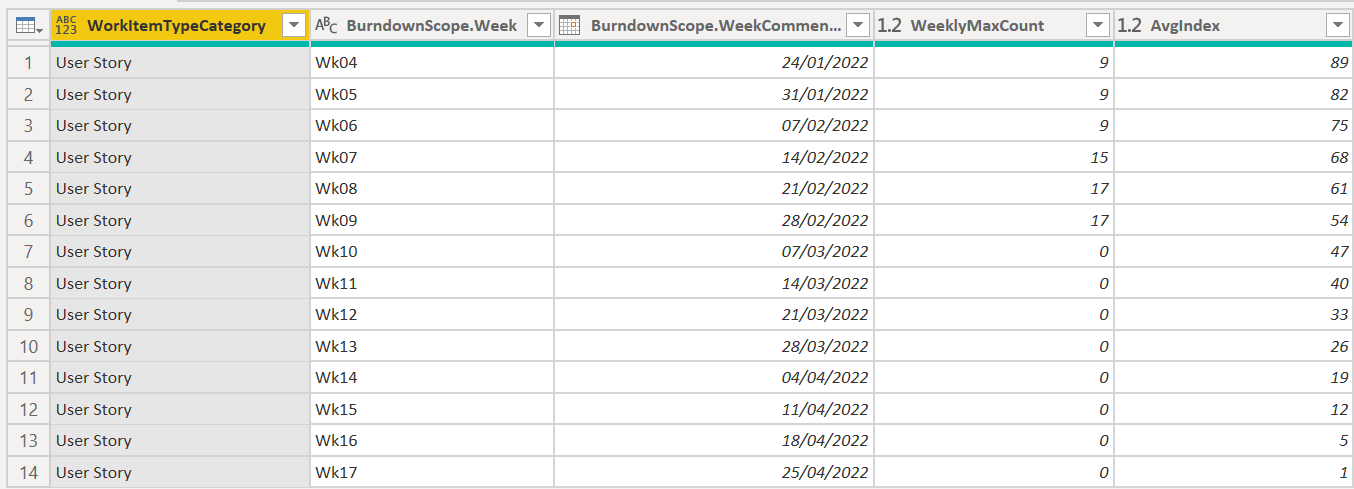
This sort of data immediately lends itself to modelling further predictions such as “How likely are we to hit our delivery dates?”, that sort of thing. This would usually require a simple linear regression function. To achieve this I implemented a custom PowerQuery function written in M that can be used across my data sets. Running my function on the above data set results in data like this:

You can see the final highlighted model step calls the function named “ForecastLinear”, which in turns adds a column named after the regression Y column “WeeklyMaxCount” suffixed with “Forecast”. The function itself is as follows:
let
    Forecast = (sourceTable as table, datecol as text, xcol as text, ycol as text) =>
        let
            range = Table.SelectRows(sourceTable, each Record.Field(_, datecol) <= Date.From(DateTimeZone.UtcNow())),
            rowcount = Table.RowCount(range),
            sumx = List.Sum(Table.Column(range, xcol)),
            sumx2 = List.Sum(List.Transform(Table.Column(range, xcol), each Number.Power(_, 2))),
            sumy = List.Sum(Table.Column(range, ycol)),
            sumxy = List.Sum(Table.TransformRows(range, each Record.Field(_, xcol) * Record.Field(_, ycol))),
            avgx = List.Average(Table.Column(range, xcol)),
            avgy = List.Average(Table.Column(range, ycol)),
            Slope = ((rowcount * sumxy - sumx * sumy) / (rowcount * sumx2 - Number.Power(sumx, 2))),
            Intercept = avgy - Slope * avgx,
            Result = Table.AddColumn(sourceTable, Text.Combine({ycol, "Forecast"}), each if (Record.Field(_, datecol) > Date.From(DateTimeZone.UtcNow())) then Intercept + Slope * Record.Field(_, xcol) else 0, type number )
        in
            Result
in
    Forecast
The function expects your source table, your date column (in my case there is always a date column and it is used for determining the known value range versus the forecast range) and then of course the names of the x and y cols.
Once you add this as a ‘Blank Query’ via the Advanced Editor in PowerQuery you can easily call this function from your model query – also using the Advanced Editor or by simply adding a blank step.

Credit
This solution would have taken me considerably longer without the work of those that came before, namely Daniil Maslyuk over at https://xxlbi.com/ with his excellent breakdown of simple linear regression in DAX: https://xxlbi.com/blog/simple-linear-regression-in-dax/
